What is Cohortum?
Cohortum turns a raw clickstream event log into a comprehensive, auto-generated analysis of how users move through your product.
Upload an event log — a CSV or Parquet file of your raw product events — and Cohortum draws how people actually move through your product.
What Cohortum does
Most analytics tools make you decide what to measure before you see anything — name the funnel, pick the steps, wire up the report. Cohortum flips that. It reads your raw events, groups them into sessions per user, and draws the paths people actually take, so you spot the drop-offs and detours you didn't know to look for.
It's built for teams who live in behavioral data:
- Product managers checking how a feature actually gets used.
- Designers seeing how people really move through a flow they shipped, versus the path they intended.
- Growth and marketing teams hunting for where activation stalls.
- Data analysts who want quick exploratory views over event logs without hand-building every report.
The core idea: events become sessions become views
Your event log is just rows — each one a user, an action, and a time. Cohortum does two things with it.
First, it groups the raw events into sessions for each user — either by an inactivity gap, or by a session column you name at upload. Then it renders that activity as a series of complementary views, each answering a different question about how people behave.
Visualization types
Pick a Level from the left sidebar — Events Analysis, Sessions Analysis, or What-If. The Level decides what a single unit of analysis is:
| Level | Unit of analysis | Use it when |
|---|---|---|
| Events Analysis | A single action (event), placed inside the user's sessions | Default. You want the step-by-step flow of what people actually do. |
| Sessions Analysis | A whole session | You want the user's journey at the level of entire visits — each unit is a complete session (a visit pattern), not a single action. |
| What-If | Goal-reachability simulation over the transition graph | You want to ask how a change to one step would move overall conversion. |
You'll reach for Events Analysis most of the time — it works action by action, with every event scoped to the user's sessions. Sessions Analysis zooms out: each unit of analysis is a whole session, so you read the user's journey across entire visits rather than single actions. Either way, the same workspace gives you the same four tabs, in this order:
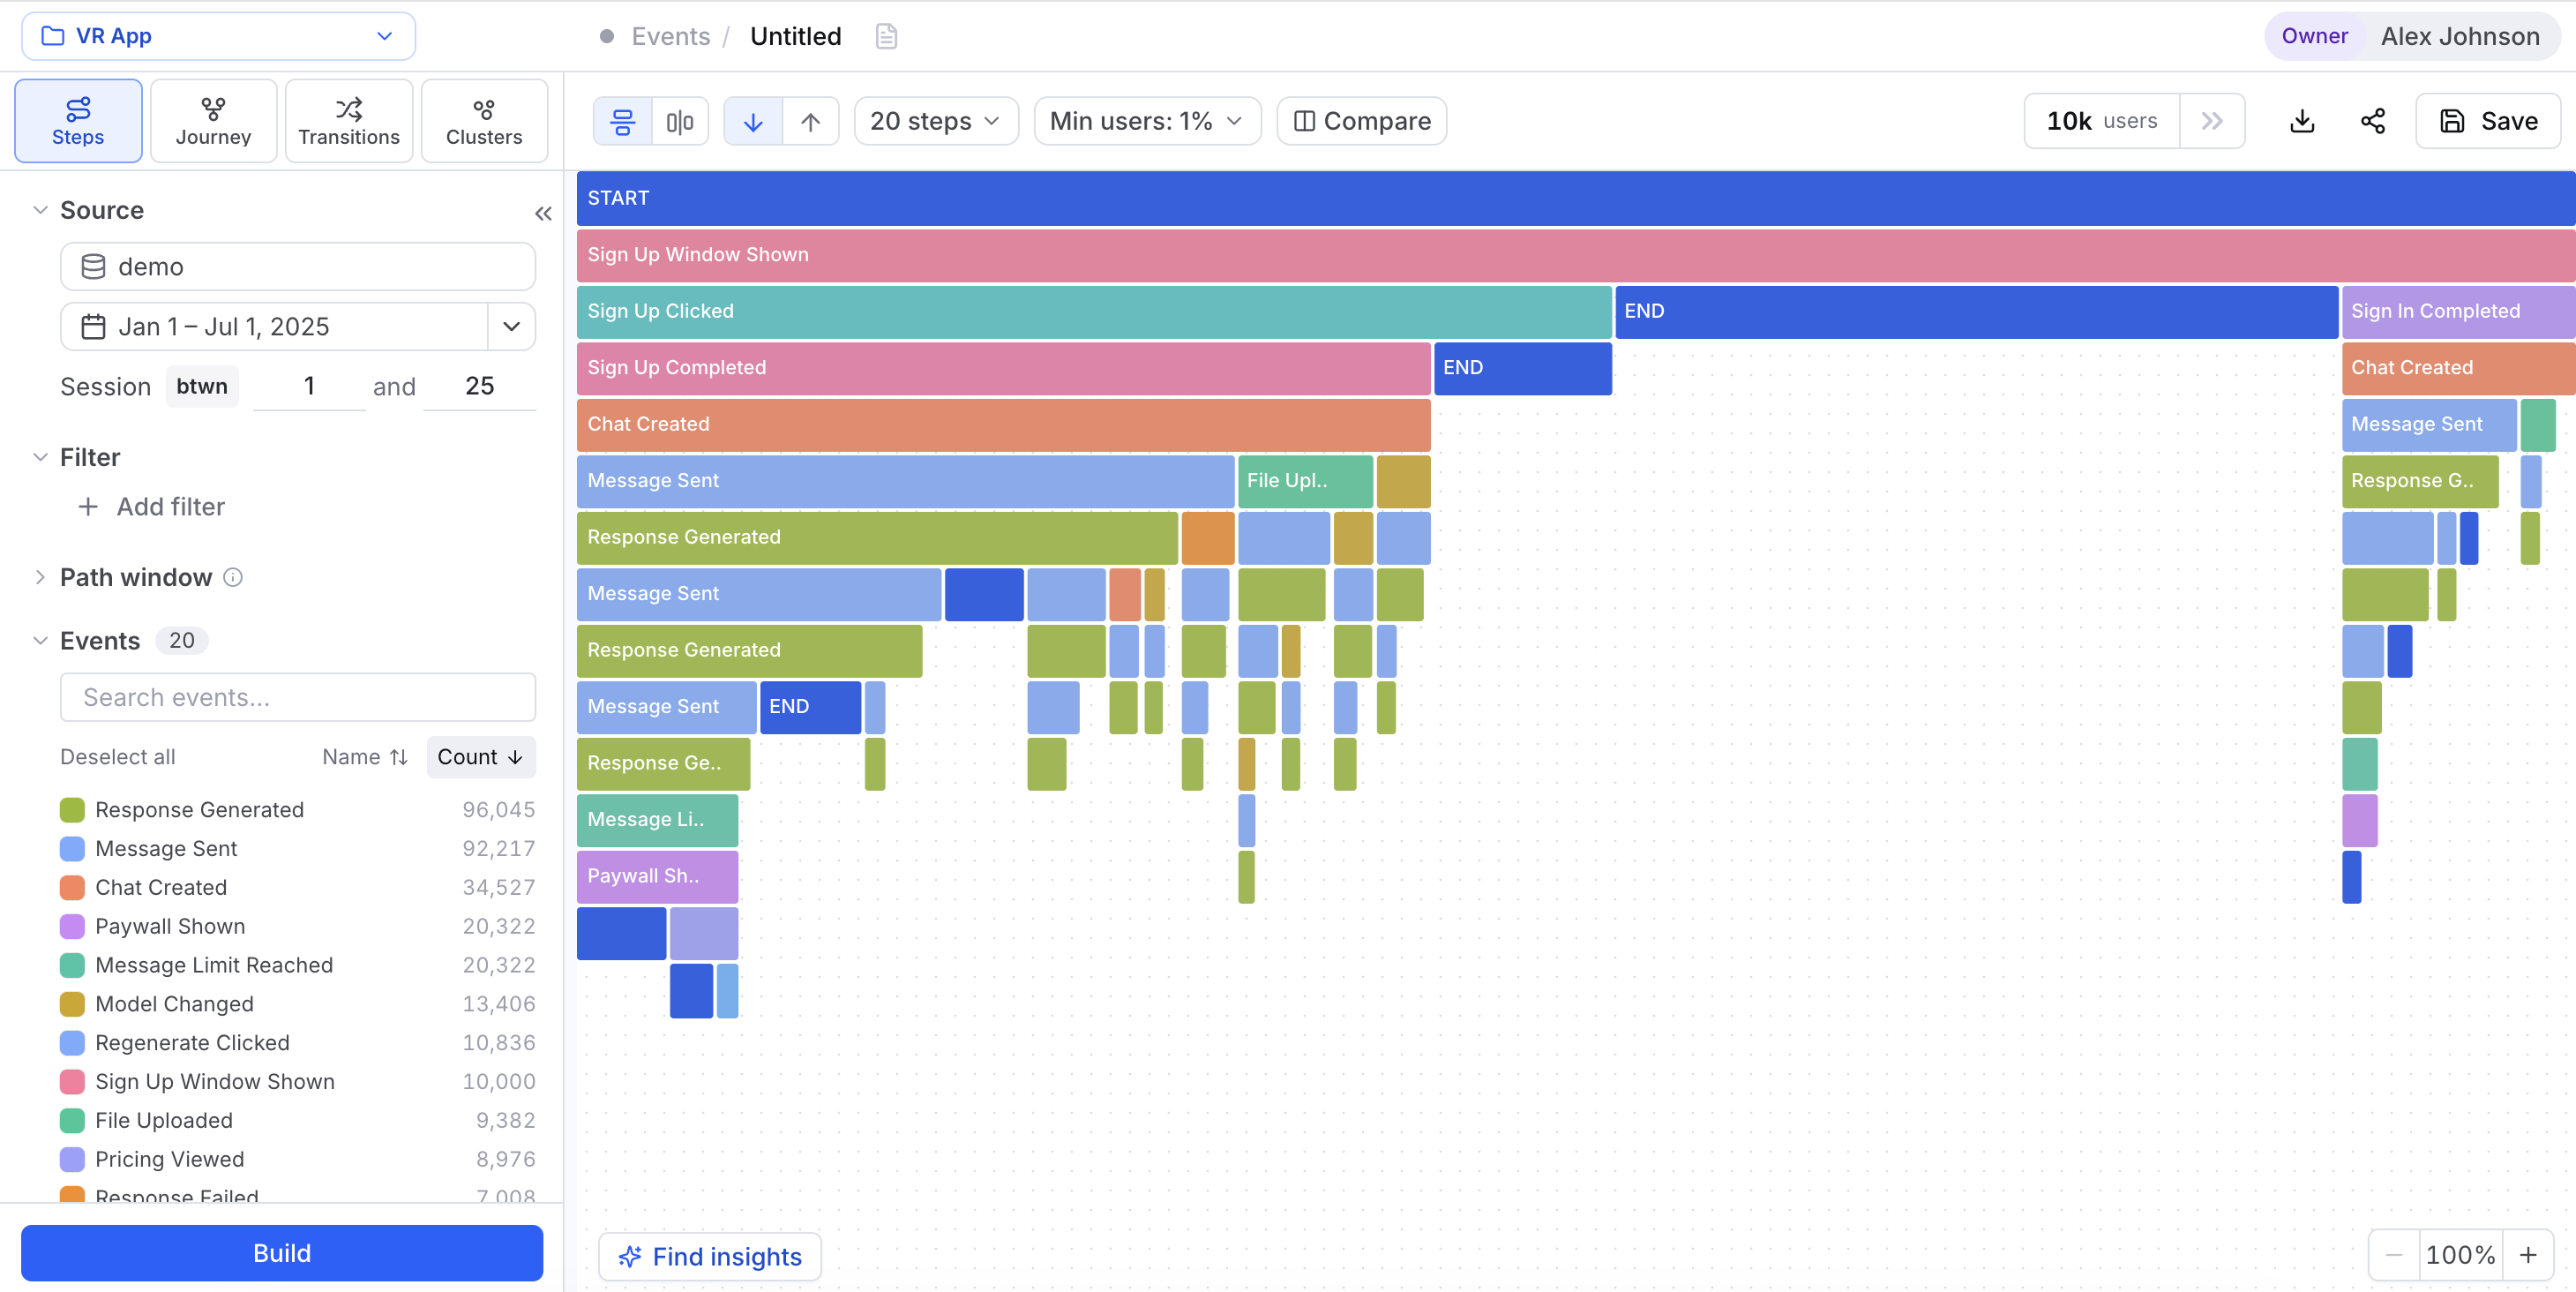
- Steps — a path tree that starts from one point and branches out. See how users fan out and which step loses them.
- Journey — a flow graph (a DAG) built from the event sequences people repeat, with a minimum-support control that trims it down to the paths worth seeing.
- Transitions — a node-and-edge graph (or an N×N matrix) showing which events lead to which, weighted by how many users make each move.
- Clusters — behavioral segments Cohortum finds on its own, grouping users by how they act so distinct usage patterns surface without you defining them.
Each view has its own guide. New here? Start with the Steps view.
What-If: simulate reaching a goal
What-If is its own analysis level. Pick a target event and Cohortum models how users flow toward it across the transition graph. Edges are colored by Sensitivity — how much each transition shifts your odds of reaching the goal.
Click any edge and nudge its conversion rate. The Impact on target panel shows the Baseline, Current, and Δ (in percentage points) — answering a question funnels can't: if this one step converted better, how much would your overall goal-reach move?
Working across your data
Your work lives in a project, which sits inside your workspace. A few features run through every view.
Filters narrow any view by user or event properties, date range, and session range. Every analysis carries a Filter block you can tighten as you go.
User Cohorts are user segments you save and reuse. Build one from a live drill-down (a Steps prefix, a Transitions node, a cluster), upload a CSV of user IDs, or write a dynamic "users who…" rule. Once it's saved, you can drop a cohort in as a filter anywhere.
Compare overlays two groups on the active chart. Open the Compare dialog, define Group A and Group B (with an optional complement) or split on a numeric field, and Cohortum recolors the chart to show where they differ.
Saved analyses snapshot the full state of a workspace — filters, tabs, compare setup — so you can reopen it later. The Share link button copies an in-app link to that snapshot; any teammate with source access can open it.
There's no self-serve signup. A Cohortum operator sets up your workspace, and you sign in with your account. Inside it, roles — Owner, Admin, Creator, and Viewer — control who can upload sources, manage projects, and share.
What you need to start
Your event log needs three columns Cohortum can map:
| Field | What it is | Example |
|---|---|---|
| User ID | Who did it | user_8f3a |
| Event Name | What they did | Video clicked |
| Timestamp | When | 2026-05-14 09:21:03 |
Everything else — user or event properties — is optional, and makes your filters and breakdowns richer. Upload a CSV or Parquet file with at least those three columns, and Cohortum takes it from there.