Clusters
Auto-group users into behavioral segments by how their sessions actually play out.
Clusters groups your users into behavioral segments on its own, so you spot patterns you'd never think to look for — the people who binge one feature, the ones who bounce, the ones who convert the slow way. It's the fourth visualization tab in an analysis workspace.
What Clusters shows
Every other tab starts from something you ask: a starting event for Steps, a path to trace for Transitions or Journey — or, over in a separate What-If analysis, a target to reach. Clusters works backwards. It looks at how each user actually behaves across their sessions and lets the data draw the segment lines for you.
Cohortum reads the events in each user's sessions, quiets down the actions almost everyone takes so the distinctive ones stand out, and groups users who behave alike into K segments. There's nothing to configure. Pick how many segments you want, hit Build.
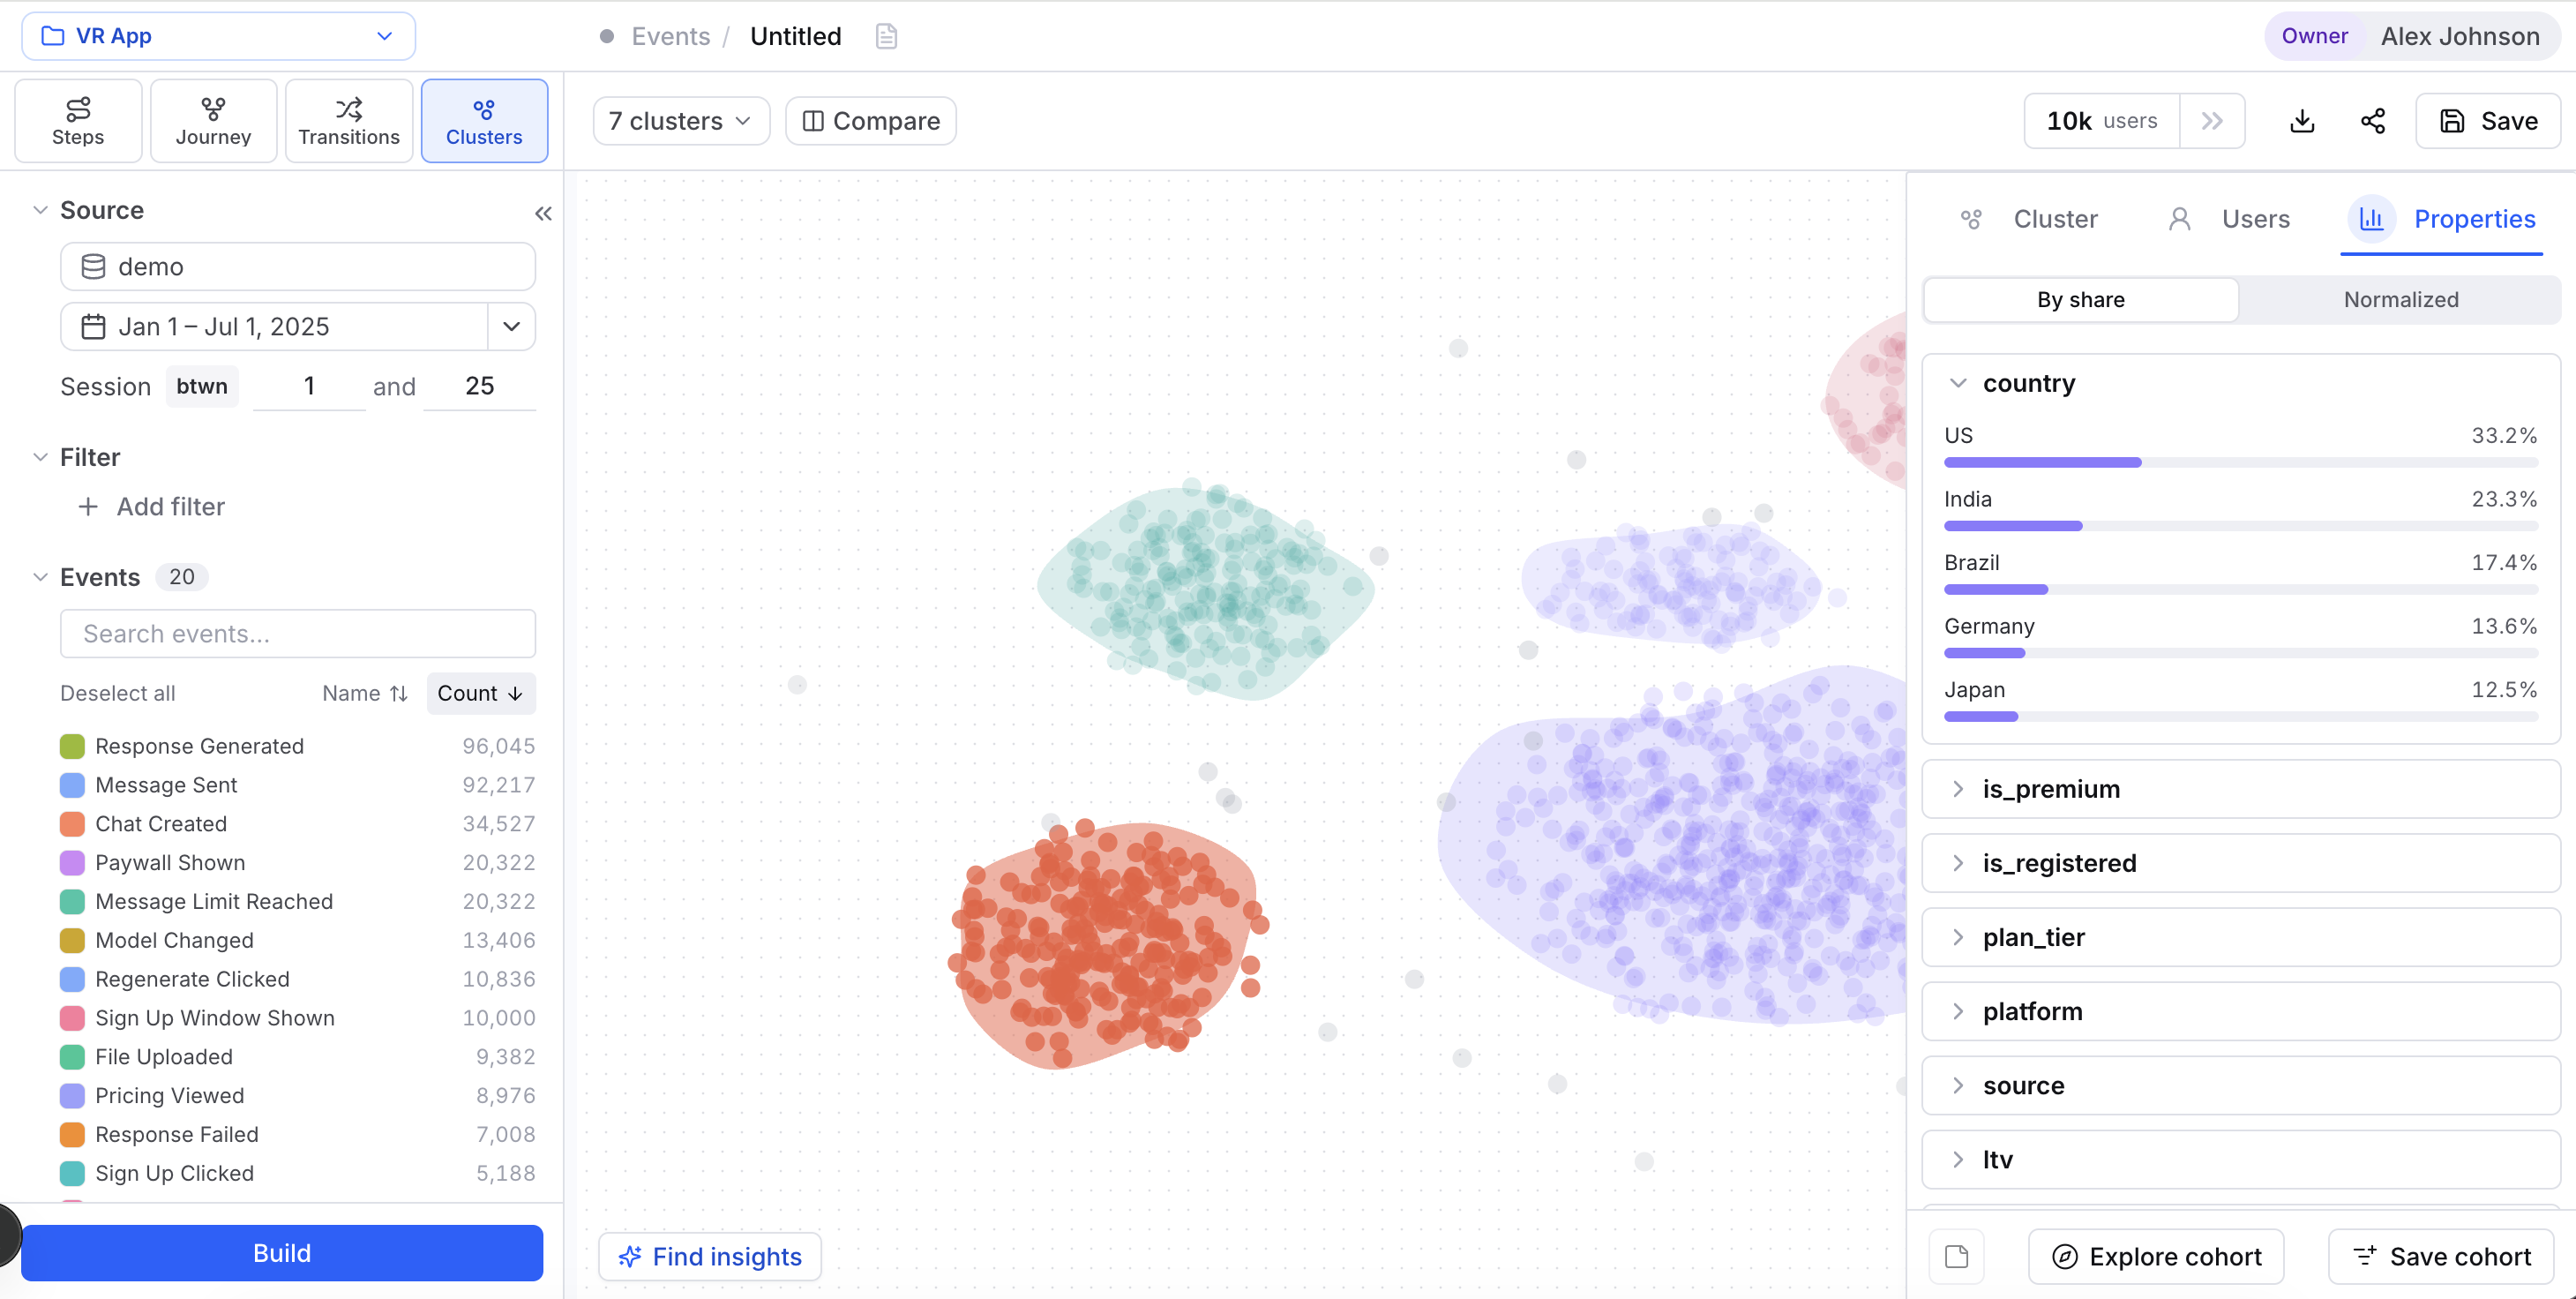
Clusters shows up in both Events Analysis and Sessions Analysis. Either way, each dot is a user — what changes is the behavior it reads. In Events Analysis it clusters on raw event patterns, so the Top patterns chips you'll meet later are event names. In Sessions Analysis it clusters on per-user session-type patterns instead, so those chips show session types rather than events.
Run a clustering
From Events Analysis (or Sessions Analysis), pick your source in the left Source panel, then switch to the Clusters tab. The tab order is Steps, Journey, Transitions, Clusters.
Use the N clusters selector in the top toolbar (labeled 3 clusters, 4 clusters, and so on). Set anywhere from 2 to 10. It defaults to 3, and 3, 4, and 5 are one-click presets.
Click Build at the bottom of the canvas. Cohortum works out the segments and draws the point cloud. It clusters your live event data through the active Filters, date range, and session range — the same scope every other tab uses — so anything you narrow before you Build changes which users get segmented. A first build on a large source usually takes a few seconds to a minute.
Click Find insights to put Cohortum's own insight engine to work and open the Insights modal. Each callout it surfaces jumps you straight to the cluster and pattern it's about — say, a segment that leans hard on one particular event, or one with a much higher events-per-session average.
Clustering needs at least a handful of active users for every segment you ask for. If your source — or what's left of it after your filters — is too small for the K you picked, Build hands back fewer, coarser groups instead of the full count. If the segments come out degenerate, loosen your filters or drop the cluster count.
Fewer clusters give you broad segments that are easy to name. More clusters pull apart subtler behaviors, but they get harder to read. Start at 3, see what you get, and only bump the count up when one cluster clearly holds two different stories.
Reading a cluster
Hover any blob for its share and user count. Click it to open the right side panel, where the segment is spelled out by its Top patterns — the event sequences that set these users apart from everyone else.
Each pattern is a short chain of events shown as colored chips, like Video clicked → Page pagination clicked. Two numbers follow it:
| Number | Meaning |
|---|---|
72% | Share of users in this cluster who matched the pattern |
4.3/user | Average number of times matched users performed it |
The arrow between two chips means the second event came after the first — not necessarily right after, since a small gap of up to two events in between is fine. Patterns that fewer than 5% of the segment matched get dropped as noise, and the most distinctive ones come first. Read together, they tell you the one thing you came here for: what does this group of users actually do?
A cluster's color and number mean nothing from one N clusters value to the next. Change the count and Cohortum re-partitions everyone from scratch and clears your selection — "cluster 2" at K=3 isn't "cluster 2" at K=4. Name segments by their patterns, not their color. (Run Build again with the same count on the same data and you get the exact same clusters back — this warning is about changing K, not about repeat runs.)
Turn a cluster into a cohort
Once a segment tells a story, save it so you can reuse it anywhere. With a cluster selected, the side-panel footer gives you two actions:
- Explore cohort opens a fresh analysis scoped to just those users, so you can run Steps, Journey, or Transitions on the segment by itself.
- Save cohort saves the segment as a materialized User Cohort. Its members are snapshotted the moment you save, and the cohort shows a Clusters origin icon in the cohort list.
A saved cluster cohort acts like any other cohort: filter any tab by it, or drop it into a group in Compare. (On a saved analysis you can manage, an Add note button also shows up in the footer for annotating a cluster.)
Compare by cluster
Segments are just cohorts once you save them, so you can put two of them head to head. Open the Compare toolbar dialog, go to the Groups tab, and set Group A and Group B to two saved cluster cohorts. Every visualization then recolors to show where the two segments split — where the power users' paths peel away from the bouncers', say. See Compare for the full workflow.
When to use Clusters
Reach for Clusters when you don't already know your segments — when you want the data to suggest groupings instead of confirming one you already have in mind. It's great for:
- Discovering personas you never defined, straight from behavior.
- Sizing a hunch: suspect "there's a group that only uses search"? Clustering either surfaces it or shows it doesn't hold together.
- Seeding cohorts for deeper analysis without hand-writing a single filter rule.
When you already know the exact rule for a segment — a property value, a specific path — a filter-based cohort is sharper. Clusters is for the segments you haven't named yet.
Related
Steps
Trace step-by-step drop-off from a starting event.
Transitions
See event-to-event flow as a weighted node-edge graph.
Journey
Trace how a segment moves through your product.
User Cohorts
Save a cluster as a reusable segment.
Compare
Overlay two segments on any chart.
The side panel
Read a selection (Funnel, Users, Properties) and save it as a cohort.
Filters
Scope every tab: source, dates, session range and filters.