Saved analyses
Snapshot your view — source, filters, tab, compare, and level — and reopen it exactly as you left it or share it with your team.
Save an analysis and you save your whole view: the source you picked, every filter, the active tab, any compare overlay, and the level you're working at. Do it whenever you land on a chart worth coming back to. Reopen it later and everything's right where you left it.
Save an analysis
Say you've built a "Mobile Signup Funnel Q1" that shows exactly where people drop off. Save it now so you're not rebuilding those filters from scratch next week.
Mobile Signup Funnel Q1. Drop in a description too ("what's this analysis about?") so teammates get why it exists.Private keeps the analysis out of your teammates' Saved list — but anyone with a direct link can still open it, as long as they have source access. Think of Private as controlling who finds it, not who can get in.
What a saved analysis captures
Everything it needs to reopen the same way lives inside the snapshot — so it holds steady even after you change filters elsewhere. Here's what goes in:
- The source the analysis runs on
- Every filter, date range, and path window
- The active tab — Steps, Journey, Transitions, or Clusters
- Any compare overlay (Groups A/B or a numeric split — see Compare)
- The level (also called the mode): Events, Sessions, or What-If
What-If works a little differently. It's a single canvas — no tabs, no compare — so the snapshot skips those and records the goal (target) event plus every conversion-rate edit from the Changes log instead.
You're saving the configuration — filters, tab, compare, and level — not the computed results. Reopen it and Cohortum recomputes against whatever data the source holds now, so the numbers can shift if fresh data has landed since you saved.
And it won't disappear on you. A saved analysis stands on its own, separate from the temporary chart state that Cohortum clears out over time.
The Saved page
Open Saved from the left sidebar to see every analysis you can get to. Narrow the list with the All / Private / Shared pills up top, or search by name and description.
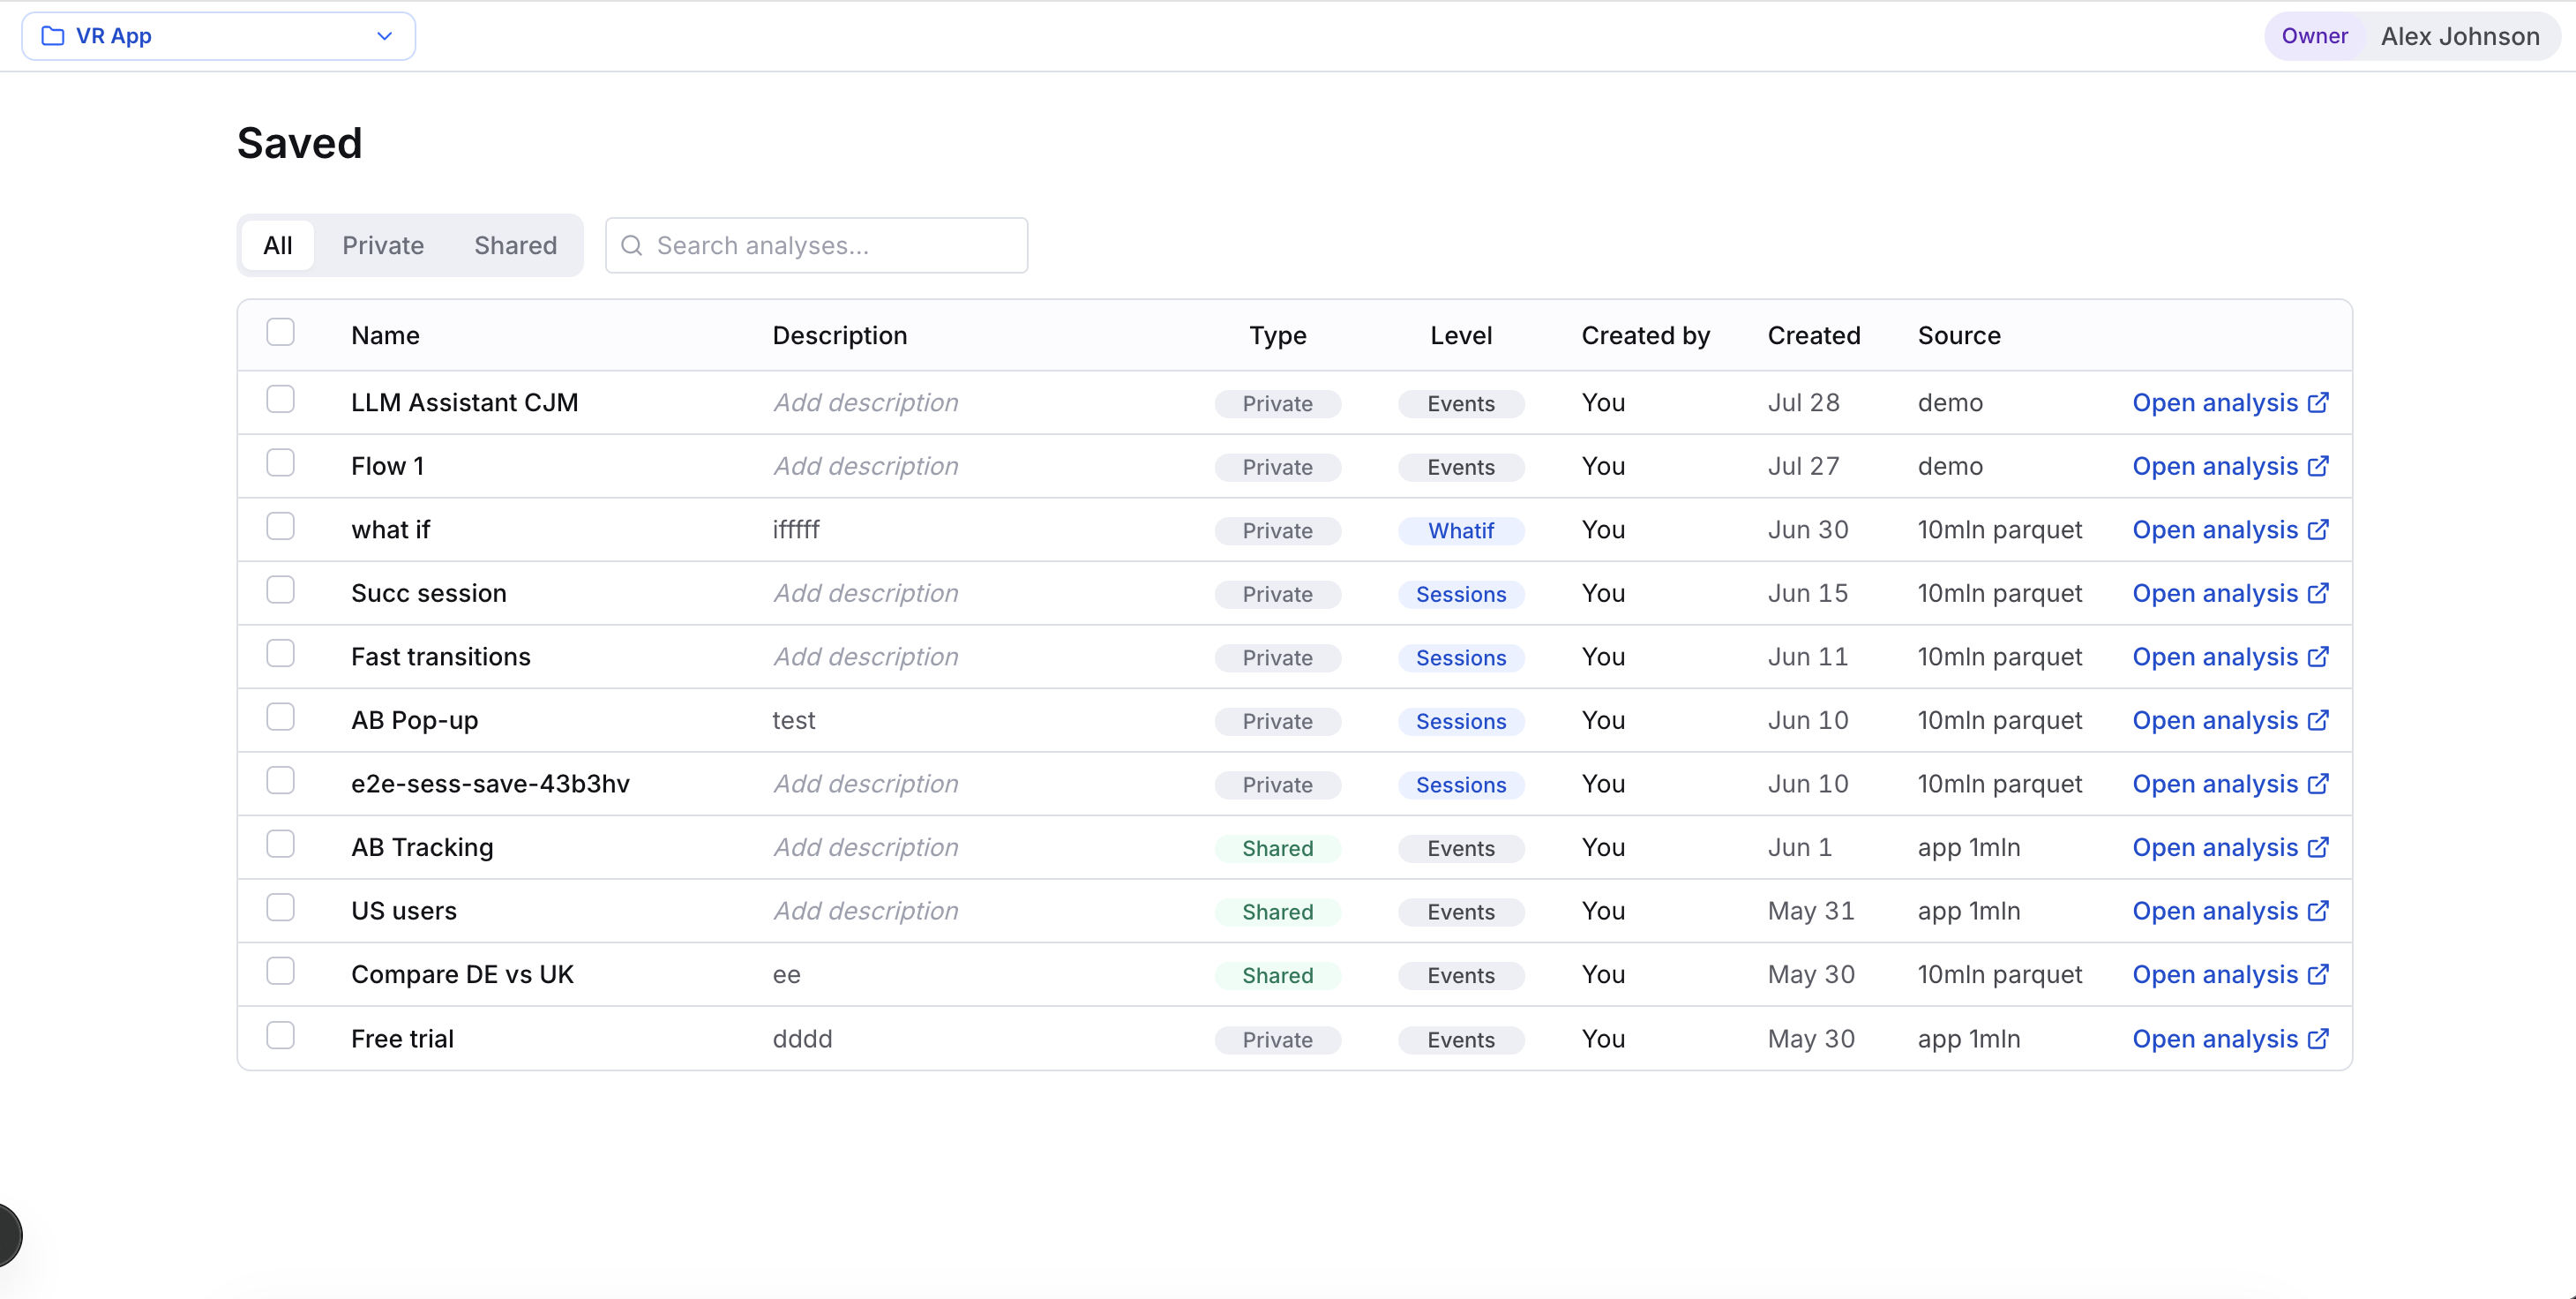
Each row shows:
| Column | What it tells you |
|---|---|
| Name | The title you gave the analysis |
| Description | Your optional note about what it's for |
| Type | Private or Shared visibility |
| Level | Events, Sessions, or Whatif — the mode it was saved in |
| Created by | Who saved it |
| Created | When it was saved |
| Source | The event log it runs on |
Click Open analysis on any row and it opens in a new tab, so whatever you're in the middle of stays put.
Every time you open a saved analysis, Cohortum re-checks your project and source access. If the source behind a row got deleted, or you've lost access to it, you'll see a degraded no-access view rather than an error — see Share links.
Rename and re-scope
Edit the analyses you own right there in the table:
- Rename by clicking the name and typing over it.
- Change visibility — tick the rows with their checkboxes, then click Make shared or Make private. One box is enough to flip a single row.
- Delete — tick the rows and click Delete. Cohortum asks you to confirm first. Again, one box handles a single row.
You can edit anything you created. Workspace owners and admins get more reach — they can rename, re-scope, or delete any shared analysis a teammate made. Everyone else's shared analyses are read-only to you, but you can always open one and hit Save as new analysis to make an editable copy of your own.
Draft vs. saved
The title in the top bar wears a little status dot that tells you where your changes stand:
- Gray — a draft you haven't saved yet
- Green — saved, nothing pending
- Amber — saved, but you've made edits since
See amber? Hit Save to fold your latest filters into the analysis, or Save as new analysis to branch off a separate copy.
A Share link makes its own hidden snapshot, so you can share without saving first. But save first and the analysis earns a spot in the Saved list — plus a name your team can search for later.