Filters
Scope every Cohortum visualization from the left panel — source, date and session range, filters, path window, and event list. Filters combine with AND.
Filters zero in on the slice of behavior you care about — one country, users who hit a paywall, last month's traffic. Set them once in the left panel and they reshape every visualization in the workspace at the same time.
The left panel
Everything you filter on lives in the left panel — the collapsible strip you toggle with «. It scopes every Events and Sessions analysis, deciding which events and users a chart is built from, and it drives all four tabs at once. Top to bottom:
- Source — the source the analysis reads from: your uploaded CSV or Parquet log. Pick it from the dropdown at the top.
- Date range — a calendar picker that bounds the analysis to a time window, with quick presets and a Custom date… option.
- Session range — the Session control. Use a
=,≥,≤, or between operator over the session number — the 1st, the Nth, or a span like "between 1 and 3" for each user, not the count of sessions. See Sessions for the full model. - Filter — the conditions this page is about, added with + Add filter. Each row is one condition; rows stack in the panel, and the × on the right removes one.
- Path window and the Events / session types list — further down.
Nothing takes effect until you press Build at the bottom of the panel.
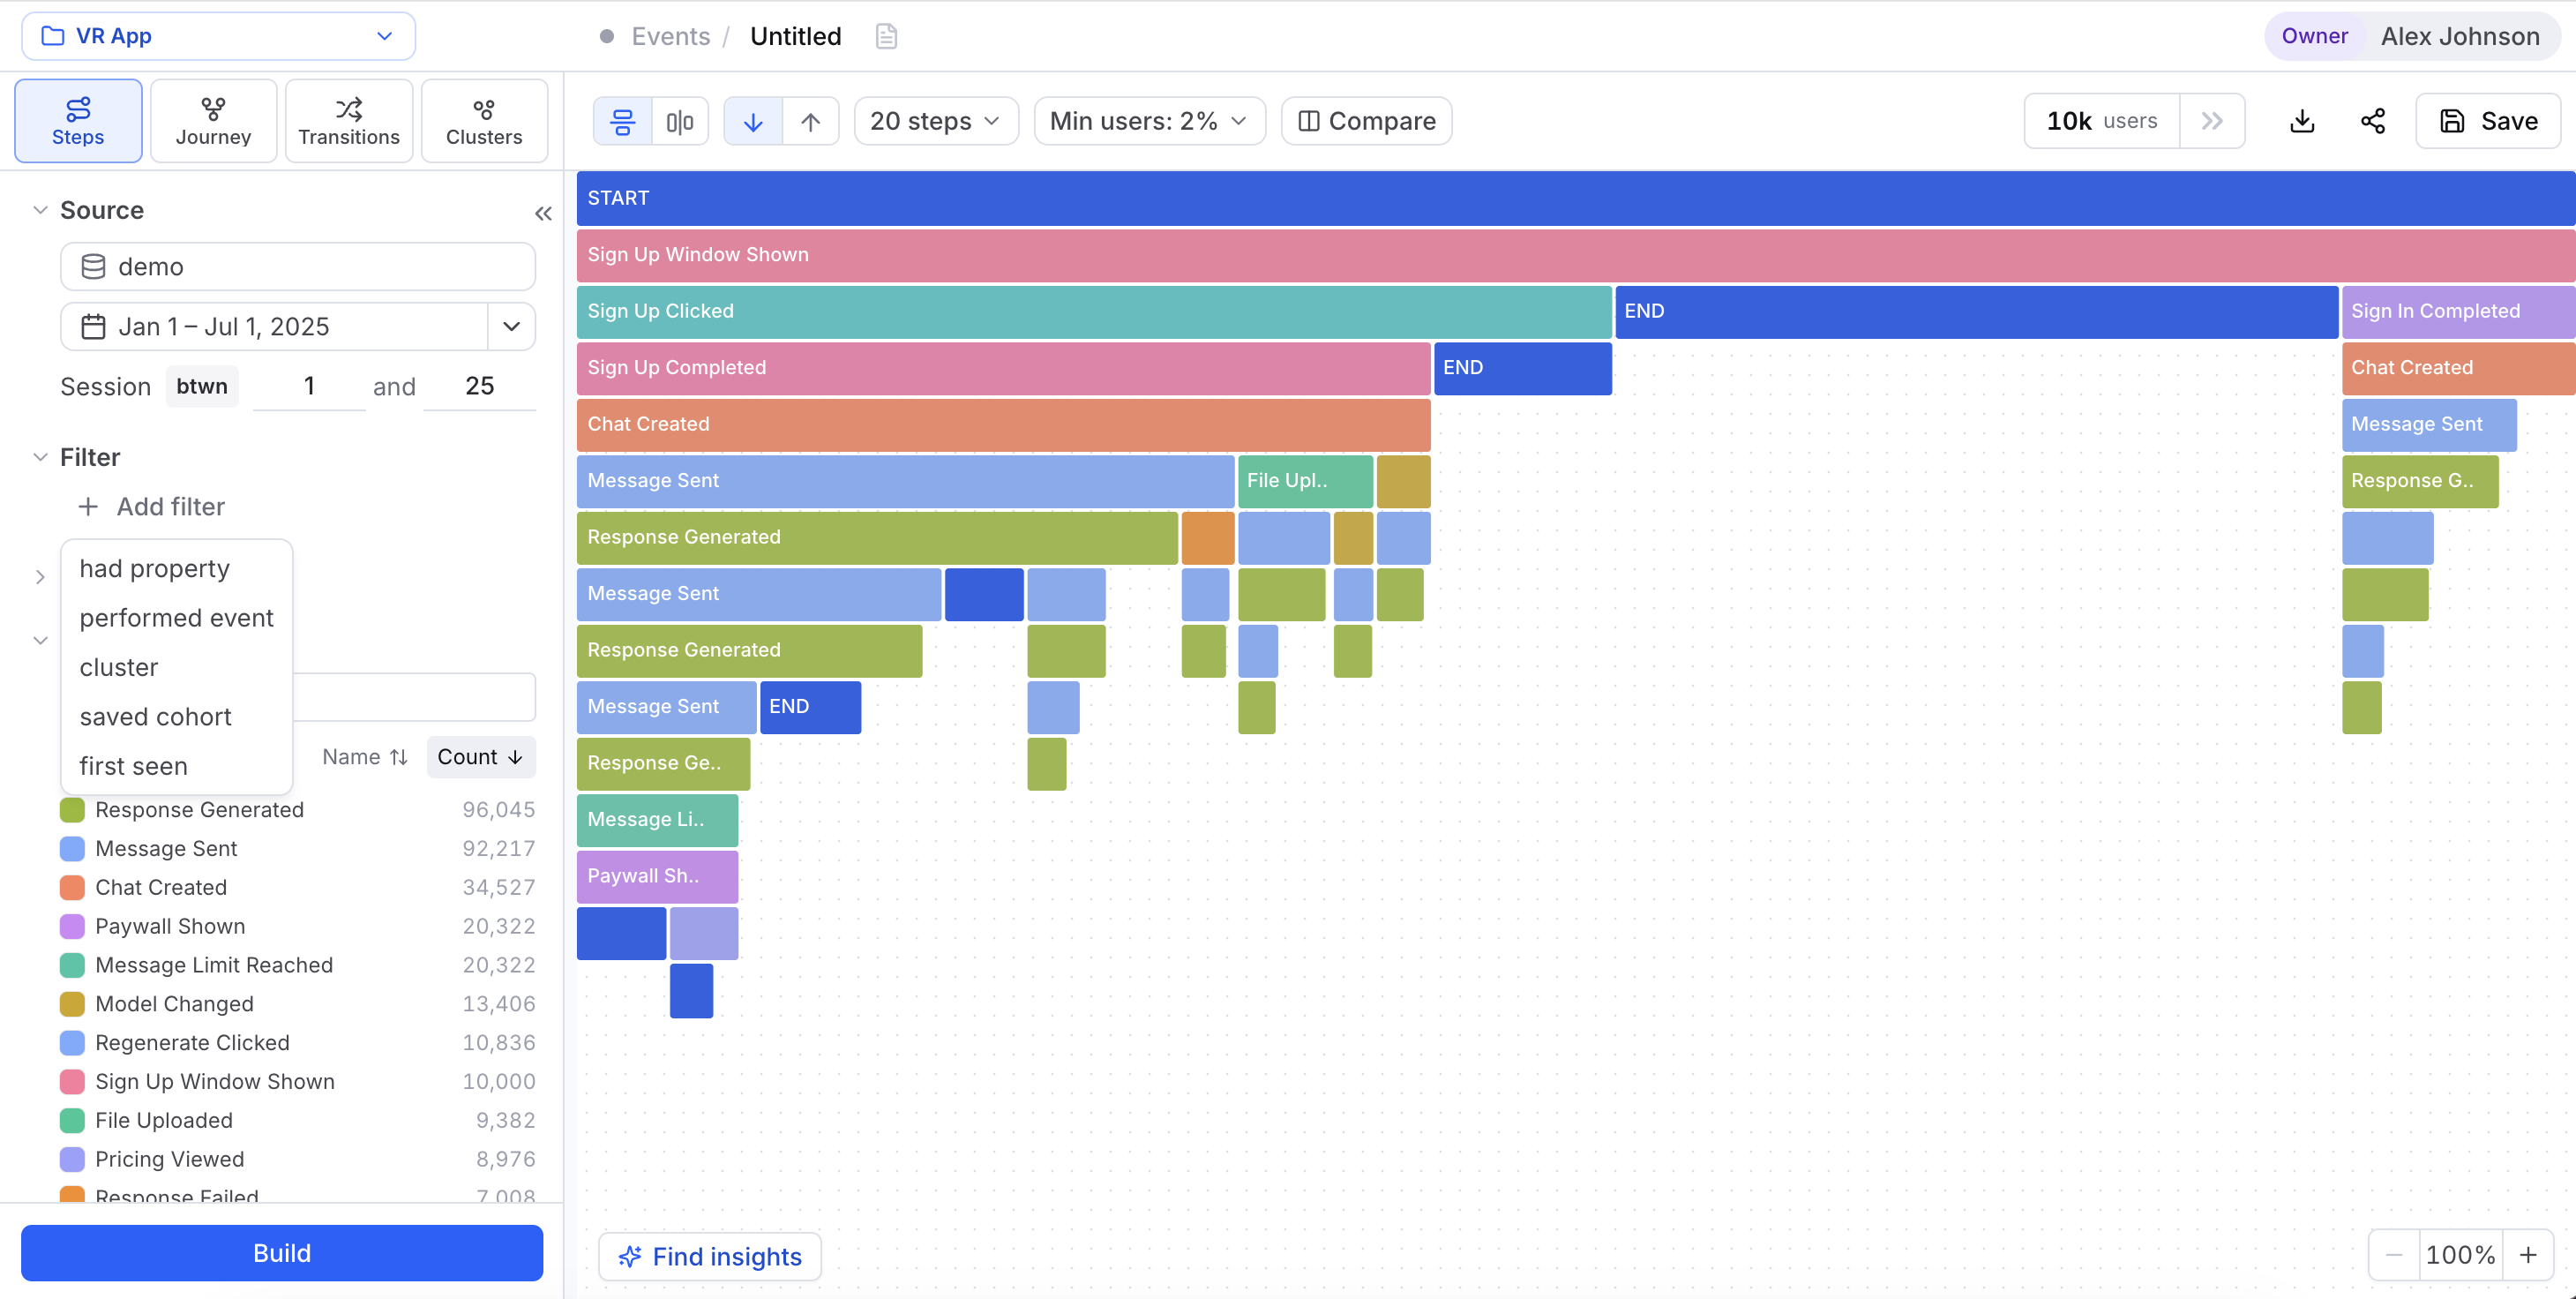
Filter dimensions
Click + Add filter to open the menu. Each entry adds a different kind of condition.
| Menu item | What it does |
|---|---|
| performed event | Keep users who fired a specific event. Add an optional where clause to match on an event property (for example, Video clicked where category = "tutorial"). |
| had property | Match on a user property — an attribute of the person, like country = "JP" or plan = "pro". The property list also includes two built-in per-session metrics (see below). |
| saved cohort | Restrict the analysis to the members of a cohort you've already built. |
| cluster | Keep only the users in one behavioral cluster. |
| first seen | An acquisition-cohort window: keep users whose first-ever event falls inside a date range you pick. |
Both had property and the performed event where clause take =, ≠, ≥, and ≤ — pick the operator from the pill next to the value. So plan ≠ "free" and age ≥ 18 work just as well as plain equality.
The had property list carries two built-in per-session metrics too — session duration and events per session. These swap the text value for a histogram range slider, so you can filter on something like "sessions longer than 5 minutes." They show up only in Events-mode analyses; in Sessions mode, per-session duration and count aren't filter dimensions.
Here's the split to keep straight: the performed event where clause filters on event properties — what got recorded on the action. The had property row filters on user properties — attributes of the person. Cohort, cluster, and first-seen rows are one each: a second would only intersect with the first, so if you need that, build a combined cohort instead.
Remember, filter changes only land when you press Build at the bottom of the panel. Edit as many rows as you want, then Build once.
Reach for had property when the attribute describes the person (country, plan, signup source), and the where clause on performed event when it describes the action (button label, page path, item category). The Events catalog controls which events appear here.
Filters combine with AND
Every filter you add tightens the result — conditions join with AND, never OR. Add performed event: Checkout started and had property: country = "JP" and you get Japanese users who started checkout, not everyone who did one or the other.
Need an OR — say, "users in Japan or Korea"? Build a cohort with that logic in the "Users who…" builder and apply it as a saved cohort filter.
Path window
(Events level only.) The Path window trims each user's path to what happened before, after, or between up to two anchor events — only the steps after Signed up, say, or those between Added to cart and Checkout completed. The chart's START jumps to the trimmed boundary, so the view begins from your window instead of the user's true first event. Expand the collapsed Path window section in the panel to set anchors.
Events and session types
The panel also picks which events feed the chart.
- Events level — every event in the source shows up with a color dot and a count. Hit Select all / Deselect all, search to find one, and sort by Name or Count. Only the events you include land in the chart; block colors and display names come from the Events catalog.
- Sessions level — the checklist turns into a list of session types, and a Mapping button opens the Edit session types editor, so you include and exclude kinds of visit rather than individual events.
What-If shares this panel — Source, date range, Session range, and Filter all apply — but it hides the Path window, and its event list is read-only (you filter on events but can't include or exclude them there).
One filter set, all four tabs
Your filters apply the same way to Steps, Journey, Transitions, and Clusters — switching tabs never wipes them. That's on purpose: the same population feeds every view, so a Steps chart you narrowed to paying users lines up with the transition graph for those exact users.
And because filters are shared, Cohortum reuses results across the workspace. When two analyses land on the same filters, they share the compute cache, so re-applying a set you've used before comes back fast.
One exception to "never resets them": on the Clusters tab, a cluster filter is hidden and inert — filtering the clustering by one of its own clusters would be circular. The condition stays in your filter set and re-applies the moment you switch to another tab, so a row that seems to vanish here hasn't been dropped.
In a Sessions analysis, performed event and had property rows carry a small user/session toggle. User level keeps everyone who matched in any session, with all their sessions; session level keeps only the sessions that matched. Click the leading icon on the row to switch. This is a different knob from the Session range field above: that one bounds which of a user's sessions enter the analysis at all (the 1st, Nth, or a span), while this toggle decides whether a filter row is judged per-user or per-session.
Worked examples
Set the date range to last month, add had property plan = "pro", then add performed event Video clicked. Press Build — the Steps chart now shows only paid users who clicked a video in that window.
Add a first seen filter and pick the quarter's dates. The analysis now covers only users acquired that quarter — an acquisition cohort you can carry across every tab and into Compare.
Filters, cohorts, and compare
These three stack. A saved cohort is itself a reusable filter — build a segment once, apply it anywhere. And once your population is scoped, Compare splits it into Group A vs. Group B (or a hi/lo numeric split) so you can watch two slices of the same filtered set behave differently.