Events
What an event is in Cohortum, the data it carries, and how the discovered catalog turns your raw log into named, colored, active-or-excluded events.
Everything in Cohortum is built out of events. Every chart, filter, and cohort comes from counting and ordering them. So it pays to know what an event is and how Cohortum turns your raw log into a named catalog.
What an event is
An event is one thing a user did at one moment. "Video clicked" at 12:04, "Page pagination clicked" at 12:05, "Checkout started" at 12:11 — every row in your event log is one event.
That one idea drives the whole product. To draw a Steps chart or a Transitions graph, Cohortum reads your stream of events, groups them by user, and puts them in time order.
The anatomy of an event
Every event carries a few things:
- Event name — what happened, e.g.
Video clicked. This is the label you see everywhere in the app. - Timestamp — when it happened. Cohortum uses it to order events into paths and split them into sessions.
- The user it belongs to — who did it, identified by a user id. This is what stitches one person's events into a single path.
- Event properties (optional) — extra detail about that one event, e.g.
video_idorpage_number. - User properties (optional) — attributes of the person, e.g.
countryorplan, that ride along with every event they fire.
When you upload, you pick which columns become the event name, user ID, timestamp, and the two property buckets. See Sources and loads for how column mapping works.
The event name tells you what happened ("Video clicked"). Properties tell you which one or for whom ("video_id = 42", "country = JP"). Both come from your log — you decide their roles when you map columns.
How Cohortum builds your event catalog
Cohortum builds the catalog for you the moment a source finishes loading. It reads the distinct event names in your data and writes one row per name, with usage stats attached — you never define events by hand. What you get is exactly what happened in your log.
Open it from Events in the left sidebar. Each row shows the event's color, its names, how often it happens, when it first and last appeared, and whether it's active.
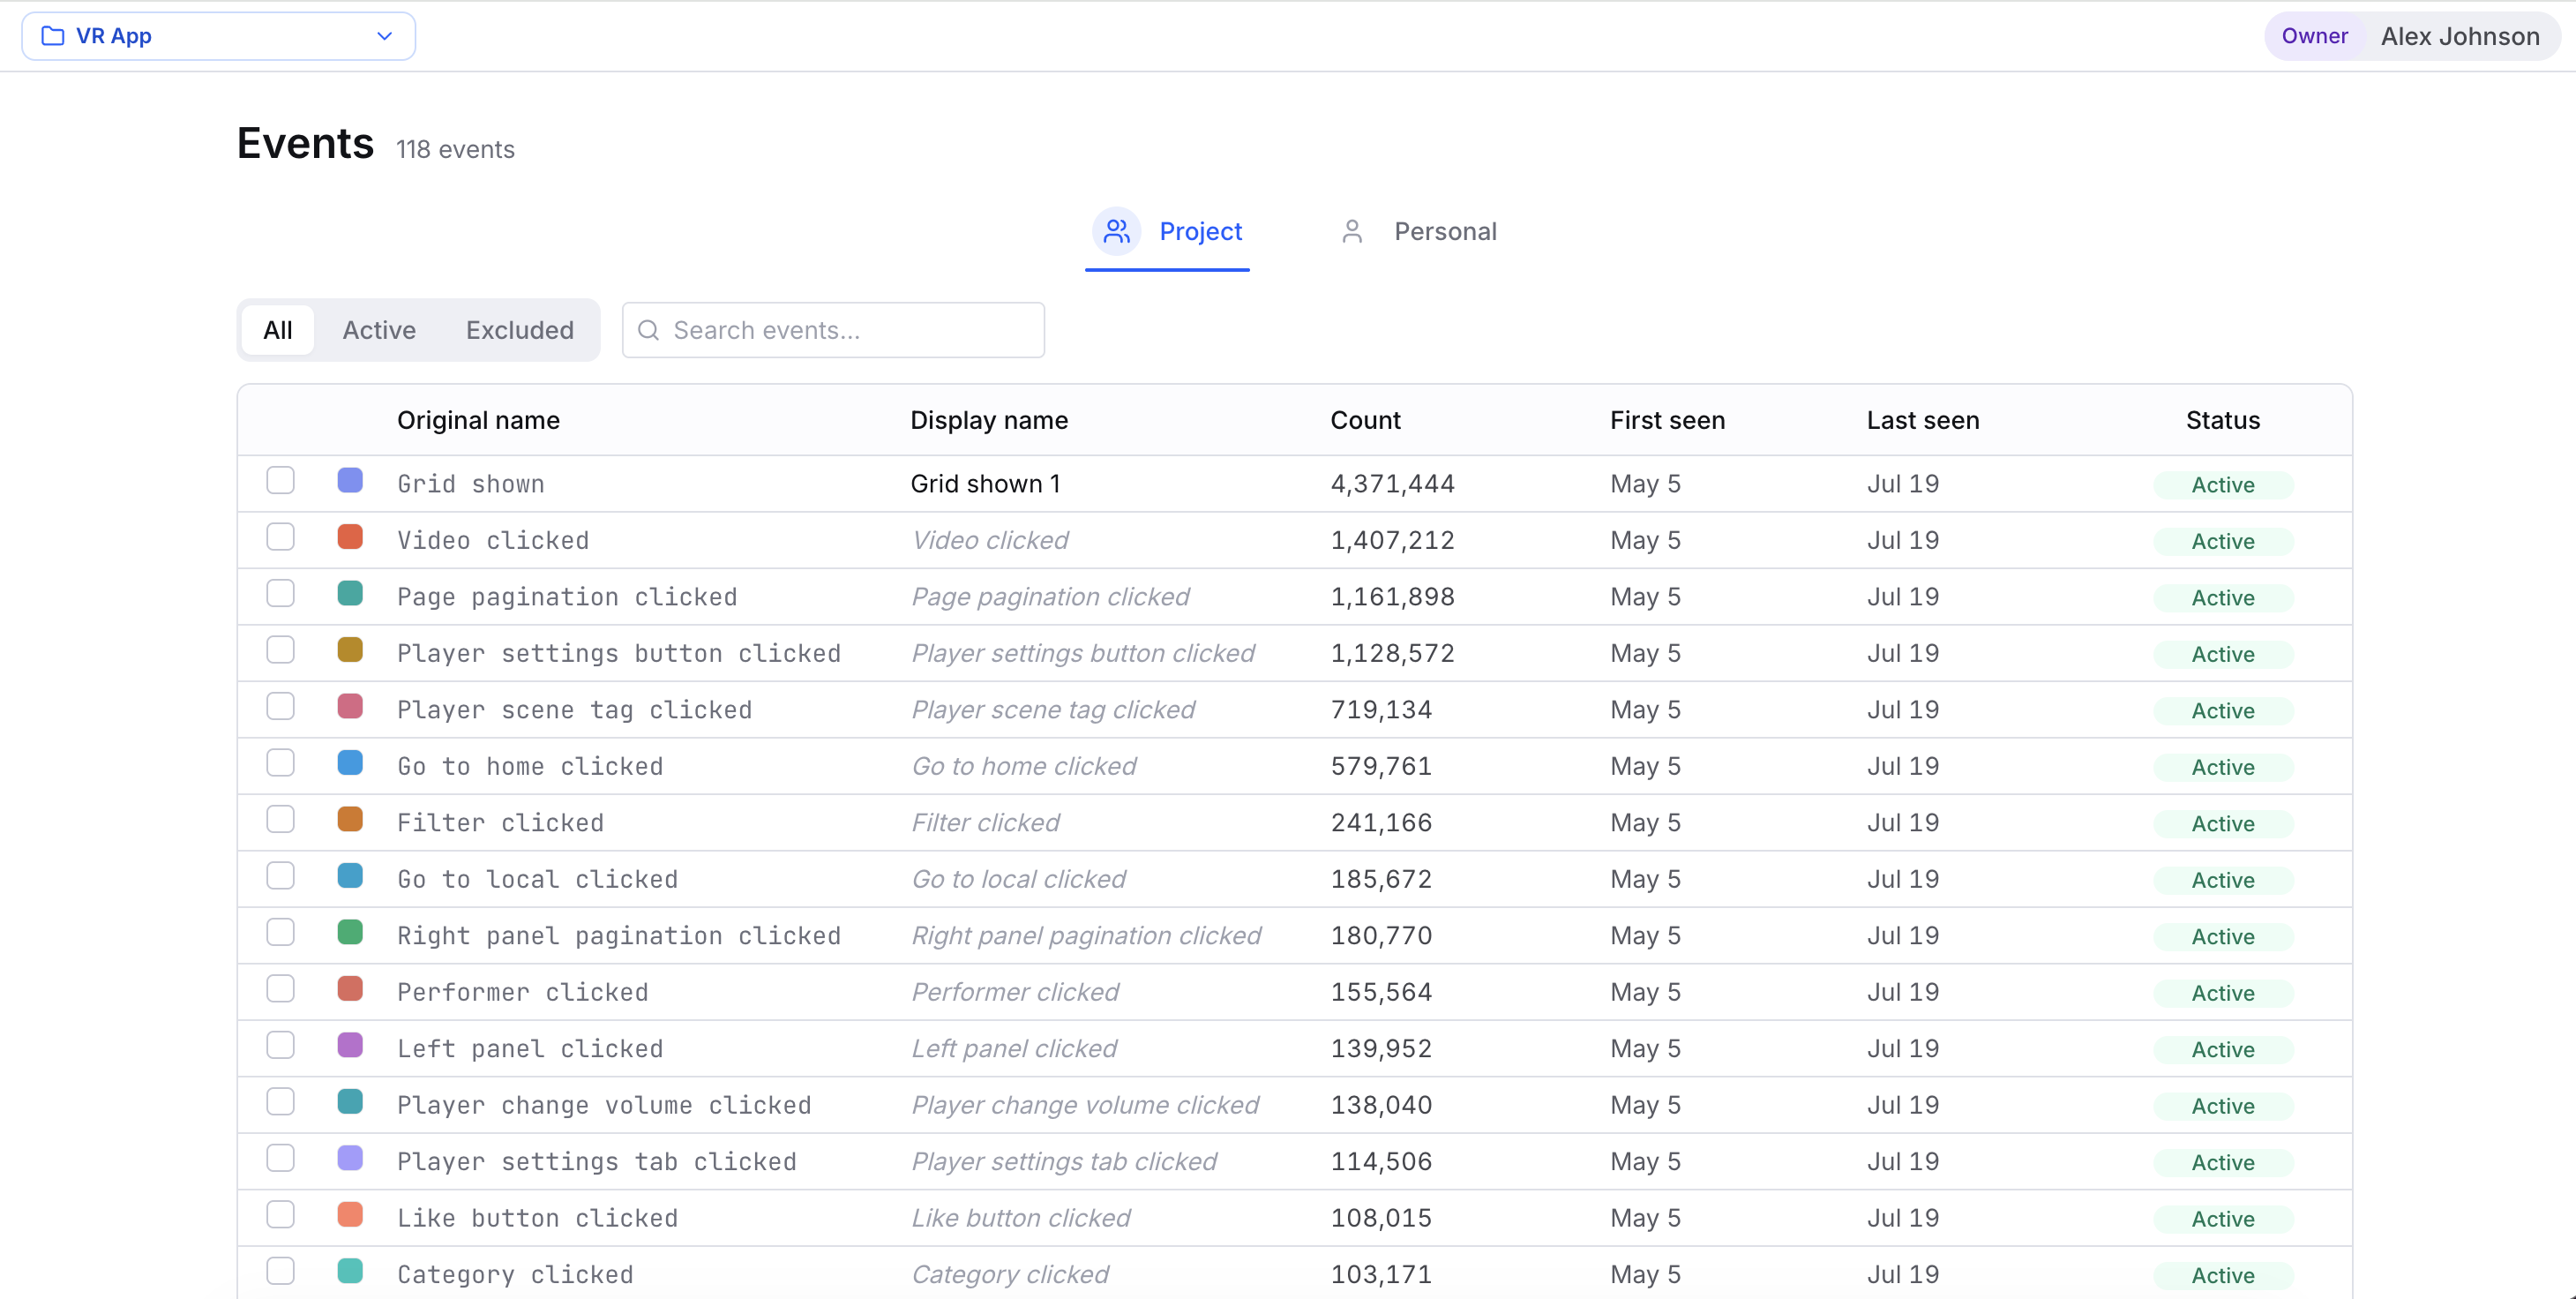
New event names always start out Active. So when a later load brings in a brand-new — and maybe noisy — event type, it shows up in your charts right away instead of hiding. After a big load, swing by the Events screen and exclude anything you don't want cluttering your paths.
This page is about the concepts. For the how-to — renaming inline, bulk-excluding, picking colors, switching scope — see Event catalog.
Original name vs. Display name
Raw logs are rarely pretty. An event might land as video_clicked_v2 or evt.pdp.add_to_cart. So Cohortum keeps two names side by side:
- Original name — exactly what came from your file. It never changes, so it always ties back to the source data.
- Display name — a friendly label, like "Video clicked" or "Add to cart". This is what shows up in every chart, filter, and side panel.
Renaming an event touches only its Display name. The Original name stays underneath, so renames are cosmetic and you can undo them anytime.
Renaming works per Original name. Give two different Original names — say add_to_cart_v1 and add_to_cart_v2 — the same Display name, and they still count and draw as two separate events with their own colors. Cohortum never merges them. To fold two raw names into one logical event, combine them upstream before you upload.
Active vs. Excluded events
Some events aren't worth analyzing. Health-check pings, debug events, and noisy auto-fires just clutter a path chart. So each event has a Status:
- Active — counted and drawn in every visualization, filter, and count.
- Excluded — dropped from what charts compute and draw. The data stays in your source and the row stays in the catalog; it just stops showing up in visualizations, counts, and paths. You'll still find excluded events in the Filters event pickers, so you can always slice on them when you need to.
Excluding an event isn't deleting it. Your source row count doesn't budge, and you can turn an event back on whenever you like. Use it to quiet the noise, not to throw away data.
Event colors
Each event gets one color that follows it across the Steps chart, the Transitions graph, the Journey DAG, and the event list in the analysis panel. That consistency is what makes a path readable at a glance — "Video clicked" is the same hue wherever you see it. Override any event's color from the catalog to make key events pop, or to match a mental model your team already shares.
Personal vs. Project scope
Renames, colors, and exclusions live in one of two layers. The Project layer holds the shared, canonical labels for the whole team. The Personal layer holds private tweaks that change only your own view and sit on top of the project defaults. A toggle at the top of the Events screen picks which layer you're editing. See Event catalog for how the two layers interact and how to reset your personal overrides.
Only an Owner, Admin, or a Creator with upload rights (the Upload sources permission) can edit either scope — and only they see the scope toggle. Viewers, and Creators without upload rights, get a read-only Project view: they can browse, sort, search, and filter, but they can't set their own overrides. See Members & roles for the permission details.
How events power every view and filter
The catalog is the one source of truth for names, colors, and status, so what you set there ripples everywhere:
- Visualizations draw active events only, in their catalog colors, labeled by Display name.
- Filters in the analysis workspace let you keep or drop paths by event, and drill into event properties. See Filters.
- Cohorts built from a chart selection inherit the same event definitions.
Exclude a noisy event, rename a cryptic one, or recolor your north-star action, and every chart updates at once — you never have to touch each analysis by hand.
You don't edit event properties on the Events screen. They show up where you actually use them — in the analysis filter panel and the graph side panels — so you can slice by country, video_id, and the like right there.